On this page
Every email platform shows roughly the same numbers, and most of them are reported with more confidence than they deserve. One of the headline metrics has been substantially broken since 2021, several are only meaningful in relation to each other, and the two that predict long-term success are usually tucked away at the bottom of the report.
This is a guide to reading an email report honestly: which numbers to trust, which to treat as a rough trend, and which ones deserve attention long before anyone asks about open rates.
Open rate: the number everyone quotes and nobody should trust
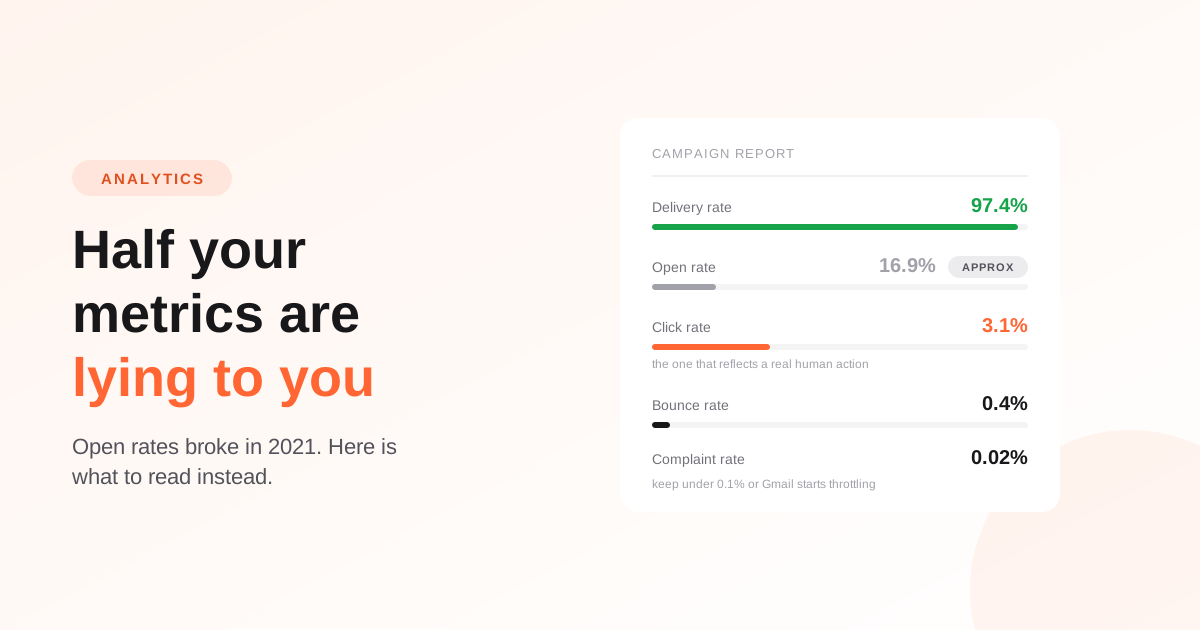
An open is recorded when a tiny invisible image loads in the message. That mechanism stopped being reliable when Apple Mail Privacy Protection began pre-loading those images on Apple's servers regardless of whether anyone read the message. Similar proxying happens elsewhere.
The result: a meaningful share of your recorded opens were performed by a machine, and you cannot tell which. Open rates across the industry jumped when MPP launched, and nothing about subscriber behaviour had changed.
- Still useful: comparing two subject lines on the same list in the same week, or watching a trend move over months.
- Not useful: comparing your open rate to a published benchmark, or reporting it to anyone as a measure of interest.
- Actively risky: building automation branches on opens. A contact who read your email on an Apple device may register as an open without reading it, and one who read it carefully with images blocked may register nothing at all.
Delivery rate, and the difference between sent and delivered
Delivery rate is delivered divided by sent — the share of messages a receiving server accepted. Healthy is 97% or better. It is the first number to check when something looks wrong, because every rate below it uses delivered as its denominator.
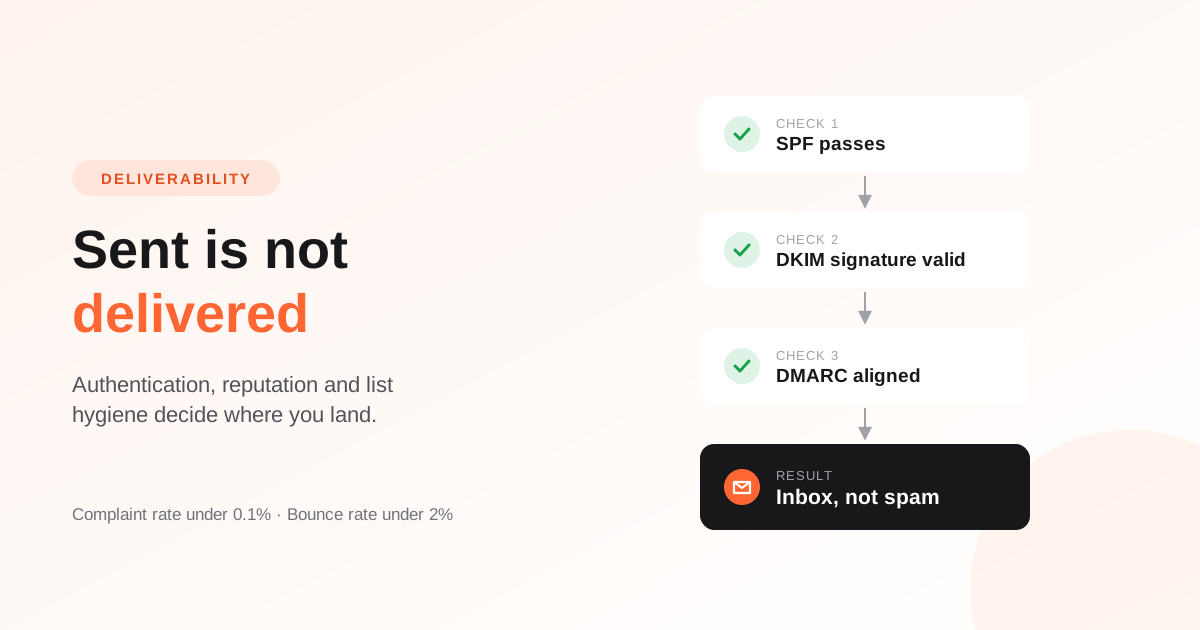
A crucial caveat: delivered means accepted, not read, and certainly not "in the inbox". A message filed straight into Spam counts as delivered. Delivery rate tells you the address exists and the server took the message. It says nothing about placement.
Click rate and click-to-open rate
Click rate is unique clicks over delivered messages. This is the metric to lead with. It reflects a deliberate human action and it is the closest thing email has to a measure of whether the message did its job.
Click-to-open rate (CTOR) is unique clicks over unique opens: of the people who opened, how many acted. Because it inherits the open-rate problem in its denominator, treat it as directional rather than exact. It is still the cleanest way to separate two different failures.
- Low open rate, high CTOR: the content works; the subject line or the sender name is not earning the open.
- High open rate, low CTOR: the subject line is doing its job, possibly too well. The message inside is not delivering what it promised.
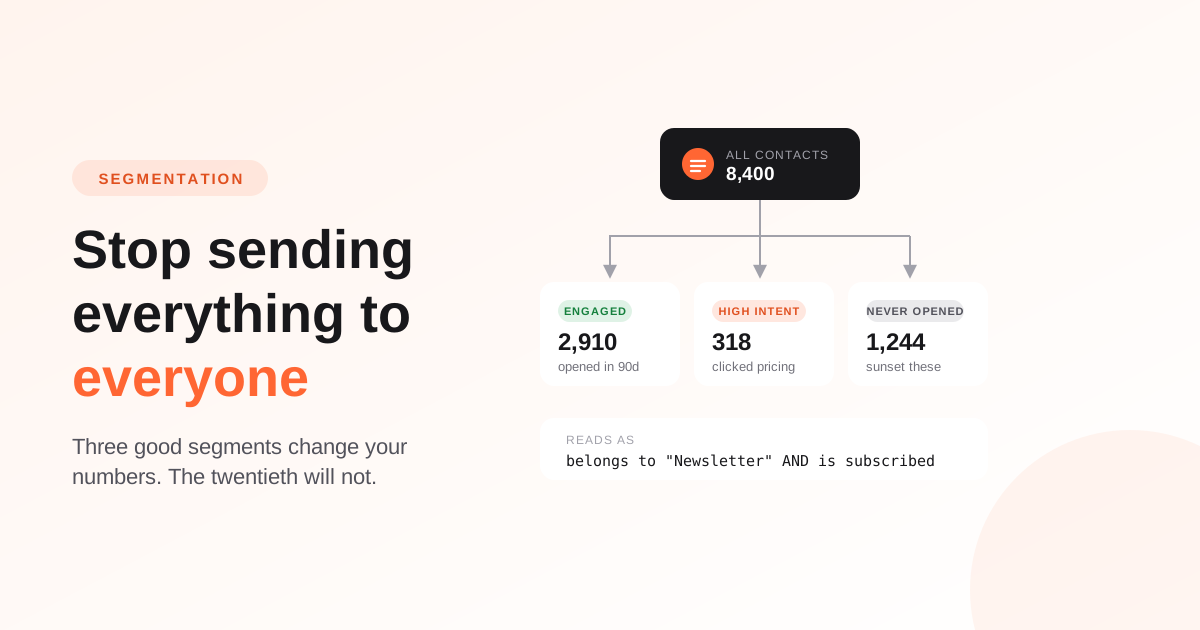
- Both low: the problem is the audience, not the copy. Look at segmentation before rewriting anything.
Always look at which links were clicked, not just how many. Three clicks on the pricing link mean something entirely different from thirty on the unsubscribe-adjacent footer.
Bounce and complaint rates: the two that decide your future
These sit at the bottom of most reports and matter more than everything above them. Engagement metrics describe one campaign. These two describe whether your next campaign reaches anyone at all.
Bounce rate should stay under 2%, and under 0.5% on a well-maintained list. Hard bounces must be suppressed permanently; if they are not, the same dead addresses get mailed on every send and the rate never improves. The specific SMTP reply behind each bounce is worth reading — "mailbox full" and "domain does not exist" call for completely different responses.
Complaint rate should stay below 0.1%. Gmail asks bulk senders to remain under 0.3% and recommends 0.1%. It sounds forgiving until you do the arithmetic: on a 20,000-contact send, twenty spam reports is enough to put you in trouble.
The metrics nobody puts on a dashboard
Per-campaign numbers hide slow problems. Three list-level measures are worth tracking monthly, even though most platforms will not surface them for you.
- Net list growth: new subscribers minus unsubscribes, bounces and suppressions. A list that looks like it is growing while its engaged portion shrinks is not growing.
- Share of the list that is engaged: contacts who opened or clicked in the last 90 days, as a percentage. When this falls, deliverability follows a few months later.
- Revenue or conversions per send, if you can attribute them. Every metric above is a proxy for this one.
What to do with industry benchmarks
Mostly ignore them. Published averages aggregate transactional and marketing mail, lists of 200 and lists of two million, across industries with nothing in common. A 22% average open rate is not a target; it is a number calculated from a population you are not part of.
Your own history is the benchmark worth having. Record your numbers for every campaign, compare each send to your own last five, and change one variable at a time so you can tell what moved. After a few months of that, you will have something no industry report can offer: a reliable sense of what normal looks like for your audience, and therefore what counts as a genuine improvement.
Frequently asked questions
Is open rate still a useful metric?
Only as a rough trend. Apple Mail Privacy Protection and similar proxies pre-load tracking pixels without anyone reading the message, so a share of recorded opens are automated. Use it to compare subject lines on the same list, never to compare yourself to a benchmark or to branch an automation.
What is a good click rate for email marketing?
Between 2% and 5% of delivered messages is typical for a general newsletter, and well-targeted segments regularly exceed it. The number varies enormously by audience and message type, so your own recent campaigns are a far better comparison than any published average.
What is the difference between click rate and click-to-open rate?
Click rate is unique clicks divided by delivered messages, measuring the whole campaign. Click-to-open rate is unique clicks divided by unique opens, measuring only the people who opened. Click rate tells you whether the campaign worked; CTOR helps separate a subject-line problem from a content problem.
Why does my campaign show 0% open rate?
Either open tracking is disabled for that campaign, the tracking pixel is not reaching recipients, or the engagement feedback is not being recorded by your platform. If clicks are being recorded but opens are not, the tracking pixel is the thing to investigate.
How often should I review email metrics?
Per campaign for engagement, and monthly for list health. Per-campaign numbers tell you whether one message worked; the monthly view catches the slow declines in engaged share and net growth that eventually turn into deliverability problems.